The Constant Absolute Risk Aversion (CARA) utility function is a measure of risk aversion. It is characterized by a constant absolute risk aversion coefficient, meaning risk aversion is the same for all levels of wealth. This is unrealistic, as wealthy investors are less affected by financial losses.
That’s the gist of it. Want a better explanation? Keep reading:
Understanding Risk Aversion Coefficients
In order to understand utility functions, you first need to know what is a risk aversion coefficient.
A risk aversion coefficient is a measure of how much utility a person gains or loses as their wealth increases or decreases. It is a measure of risk aversion under the expected utility theory in finance and economics.
What’s risk aversion? It’s the human tendency to prefer outcomes with low uncertainty over those with high uncertainty, even when higher risk means higher expected value.
In other words, it’s a measure of how much risk premium an investor is willing to pay to achieve a higher return on investment.
A person is risk averse if their certainty equivalent is lower than the expected monetary value of a gamble. The certainty equivalent is a guaranteed return someone would accept instead of taking a chance on a higher, but uncertain, return.
There are two types of risk aversion coefficients:
- Absolute risk aversion coefficient
- Relative risk aversion coefficient
In the case of the Constant Absolute Risk Aversion utility function, the risk aversion coefficient is used as a parameter in the utility function itself, and is constant. So we’ll focus on that:
Absolute Risk Aversion Coefficient
Also called the Arrow-Pratt measure of absolute risk aversion (ARA), after the economists Kenneth Arrow and John W. Pratt, this coefficient is defined as:
Where u”(w) and u'(w) are the first and second derivatives of utility function u(w) with respect to w (wealth). What does this mean?
The utility function is a mathematical representation of your preference over different uncertain outcomes. The derivative of the utility function with respect to wealth (or other parameters) measures how much the utility changes as the outcome changes.
Risk-averse investors have a positive risk aversion coefficient and a concave utility function. This means an increase in risk reduces utility.
Your risk aversion determines how much utility (benefit) you get from wealth. Instead of wealth, it can also measure the satisfaction you get from other forms of consumption such as different bundles of goods, services, or investments.
Utility, satisfaction, benefit. These are all the same concept.
A wealthy person is usually less risk-averse than a poor person. Why? Because they have a buffer against potential losses, and can afford to take on more risk without as much concern for the negative consequences.
This is why a utility function measuring risk aversion is concave.
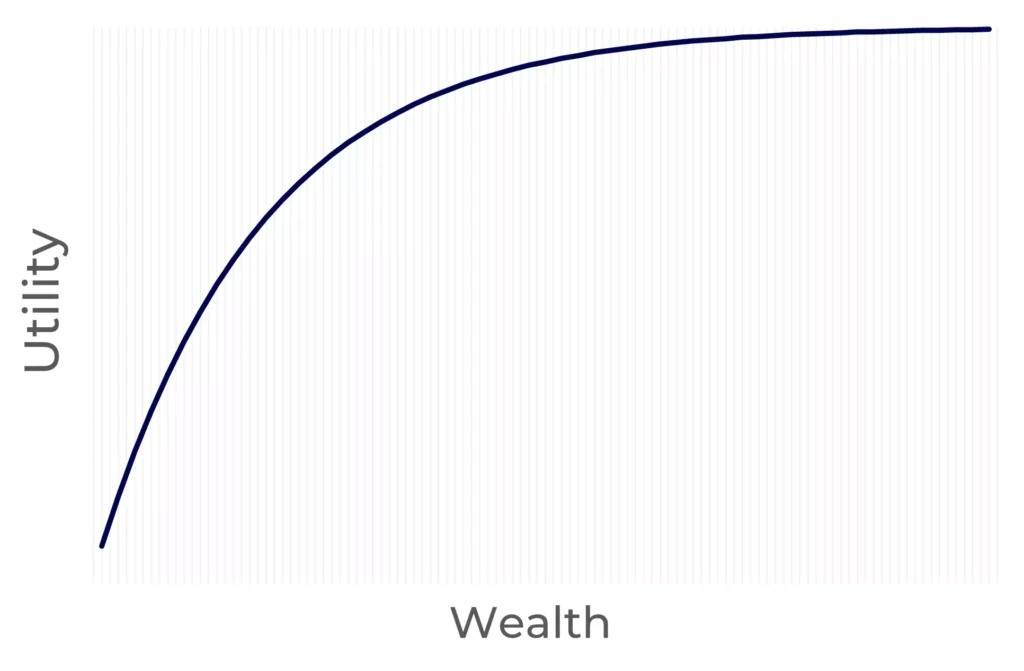
Concavity means the slope of the function decreases as the input (or wealth) increases. How do you measure slope? With derivatives.
This means that as wealth increases, the increase in satisfaction slows down. In other words, the marginal utility decreases.
The wealthier you are, the less additional utility you gain from an additional unit of wealth. Likewise, the dissatisfaction you get from a decrease in wealth is lower.
CARA utility assumes an individual’s level of risk aversion is constant, regardless of the level of wealth. (In contrast, increasing absolute risk aversion for example, assumes risk aversion increases with more wealth.)
Here’s how that works:
CARA Utility Function Formula
Where:
- α is constant and equal to the absolute risk aversion coefficient, the parameter that represents the degree of risk tolerance (α > 0 for risk aversion, α = 0 for risk neutrality, and α < 0 for risk-seeking) as we’ve seen above.
- w is the level of consumption (or any variable people prefer having more of).
In most situations however, you’re only studying risk aversion (concave utility functions). As a result, the formula is simplified to:
You’ll often see the formula further simplified to just this, as the 1 is mathematically irrelevant:
This is why the CARA utility function is also known as exponential utility.
Every CARA utility function is a monotone affine transformation of the exponential utility function.
If you take the derivative of this utility function to find the Arrow–Pratt measures of risk aversion, you’ll find that the CARA utility function has a constant absolute risk aversion coefficient (as the name suggests):
Remember, to differentiate exponential functions, you simply copy the exponential function and multiply it by the derivative of the power.
As you can see, exponential utility implies a coefficient of absolute risk aversion equal to a constant (α).
What does this mean? It means that with CARA utility there are no wealth effects.
Hence, an investor with CARA preferences will pay the same to avoid a fair gamble, regardless of what his initial wealth is.
Is this realistic? No…
Why CARA Utility is Unrealistic
Let’s imagine you’re presented with the following lottery:
- It costs $5,000 to play.
- You get one coin flip (50% probability of winning, and 50% probability of losing).
- If you win you earn $10,000, but if you lose you don’t get your money back.
This is what’s called a fair game because the expected value is zero (–$5,000 + 50%x$10,000 + 50%x$0 = 0).
But even though it’s a fair gamble, most people won’t play it. Especially those with less money.
CARA utility suggests that two people with different levels of wealth will have the same risk tolerance in this situation. The problem? This is not true.
In reality, a person with $10 million in the bank is more likely to play this game than a person with $10 thousand.
The wealthy person doesn’t care as much as losing because $5,000 is just 0.05% of what they have. Meanwhile, the person with $10k is risking 50% of their wealth in a single coin flip. They’ll hesitate a lot more to play.
This contrasts with the Constant Relative Risk Aversion (CRRA) utility function, which has a constant relative risk aversion coefficient.
CRRA utility also says that both investors will have the same risk tolerance—if—the game is in proportion to wealth.
So, for example, the game is to pay 5% of your wealth for a 50% chance of winning 10% of your wealth. This is still a fair game.
For the $10M person, it’s a $500,000 bet for a chance to win $1M. And for the poor person, it’s a $500 bet for a chance to win $1,000.
Now, yes… It makes sense to say they’ll both make the same decision.
Article sources:
Danthine, J-P. and Donaldson, J. (2005), Intermediate Financial Theory, 2nd edition, Elsevier Academic Press.
