The sticky delta rule refers to the assumption that the implied volatility of options with a certain delta will stay the same as the underlying asset price fluctuates up or down. It is also called the volatility-by-moneyness rule, as options with the same moneyness effectively have the same delta.
Put simply, the rule states that options with the same delta have the same implied volatility.
Still confused? Keep reading:
#1) Understanding Implied Volatility
Implied volatility (IV) is a measure of the expected volatility of the underlying asset of an options contract. It is the market’s forecast of a likely movement in that security’s price.
It is the volatility level that makes the theoretical value of an option—calculated using mathematical models such as the Black-Scholes (BS) pricing model, or binomial trees—equal to the current market price of the option. Thus, it is the volatility level implied by the existing market price.
The higher the implied volatility, the more expensive the option. And the lower the implied volatility, the less expensive the option is. Why?
Because high volatility means a large price swing. This price swing can be up or down. IV doesn’t predict the direction of the price change. What does this mean for options?
It means there’s a higher chance of out-of-the-money (OTM) options expiring in-the-money (ITM). Thus, the premium you need to pay will be higher to reflect that higher chance of a favorable outcome.
Low volatility means the price likely won’t make broad, unpredictable changes.
Traders often use implied volatility as a proxy for market risk. It is expressed using percentages and standard deviations over a specified time horizon.
Implied volatility is a forward-looking measure. It represents the market’s expectation of future volatility, not historical volatility. It is only an estimate of future price fluctuations, not a definitive measure of where they’ll go.
What determines it? Many factors such as interest rates, dividends, and market sentiment.
Volatility Surface
A volatility surface is a graphical representation of the relationship between the implied volatility of an option and three factors that affect the option’s price: the underlying asset price, the strike price, and the expiration date.
The Black-Sholes model assumes the volatility surface is flat and remains unchanged. This means the IV doesn’t change with time or stock price. In reality, this is not true. Each option has a different implied volatility.
OTM and ITM options have higher IV than at-the-money (ATM) options. Why?
Because OTM and ITM options are more in demand than ATM options, and because extreme events and market skew dynamics need to be factored into the options’ price.
As a result, they form a volatility smile.
A smile-shaped implied volatility surface shows that at-the-money options have lower volatility than options either in-the-money or out-of-the-money. We call the shape a smile because the curve of implied volatilities has a U-shape.
Volatility smiles are seen when comparing various options with the same underlying asset and the same expiration date but different strike prices.
The smile shape is rarely perfectly formed though. Traders are willing to overpay for OTM puts to protect themselves from potential market downturns, creating a volatility skew.
#2) Understanding Delta
Delta is one of the four greeks in options trading. It measures the sensitivity of the option price to changes in the spot price of the underlying asset.
Delta tells options traders their directional risk, in terms of how much an option’s price will change as the underlying price changes.
Calls benefit from increases in the underlying security’s price, so they have positive delta. Puts’ premiums on the other hand, rise with decreases in the price of the underlying asset, so they have negative delta.
For example, the price of a call option with a delta of 0.5 will increase by $0.50 for every $1 increase in the price of the underlying asset, all else being equal.
Low delta options (closer to zero) are less risky than high delta options because they’re less sensitive to changes in the price of the underlying asset.
Delta and Moneyness Tell You the Same
Moneyness determines how much the delta changes.
That is, whether the option is in-the-money (currently profitable), at-the-money (strike price equals underlying stock’s price), or out-of-the-money (not currently profitable).
The closer to expiration, the closer to 1 the delta of an in-the-money call option. ATM call options typically have a delta of 0.5, and the delta of OTM options goes to 0 as expiration approaches.
Also, the deeper ITM the call option, the closer the delta will be to 1, and the more the option will behave like the underlying asset.
#3) Understanding Sticky Delta
In the Black Scholes model, six things determine the price of an option: 1) strike price, 2) underlying asset’s price, 3) time to expiration, 4) dividends, 5) interest rates, and 6) volatility.
At the time of pricing, the first five variables are clear and known. As to the volatility? It’s an estimate.
Because of this, the model assumes constant volatility for the underlying asset.
As a result, the volatility surface for options priced using it is flat. This means the implied volatility is constant regardless of the strike price.
We’ve seen this is not true in real-world market conditions. OTM and ITM options have higher volatility, which changes over time.
A better way to simulate volatility is the sticky delta rule.
It is a closer representation of the volatility smile caused by lower ATM volatility we observe in reality than the fixed volatility level the BS model assumes.
Sticky something means the implied volatility for the same level of that something stays the same, even if the underlying asset’s value changes.
In other words, the volatility of all options in the same maturity depends only on the delta. Since delta and moneyness are tightly related, we can say volatility depends only on moneyness (the ratio of the price of the underlying asset to the strike price).
As a result, the implied volatility will change as the stock price changes.
The sticky delta rule states that options with the same delta have the same implied volatility.
For example, let’s say implied volatility for an ATM option is 20% when a stock trades at $100. If the stock price falls to $90, the sticky delta rule predicts the implied volatility for the 90-strike option (which is now the ATM option) is 30%. This is why it’s also known as volatility-by-moneyness.
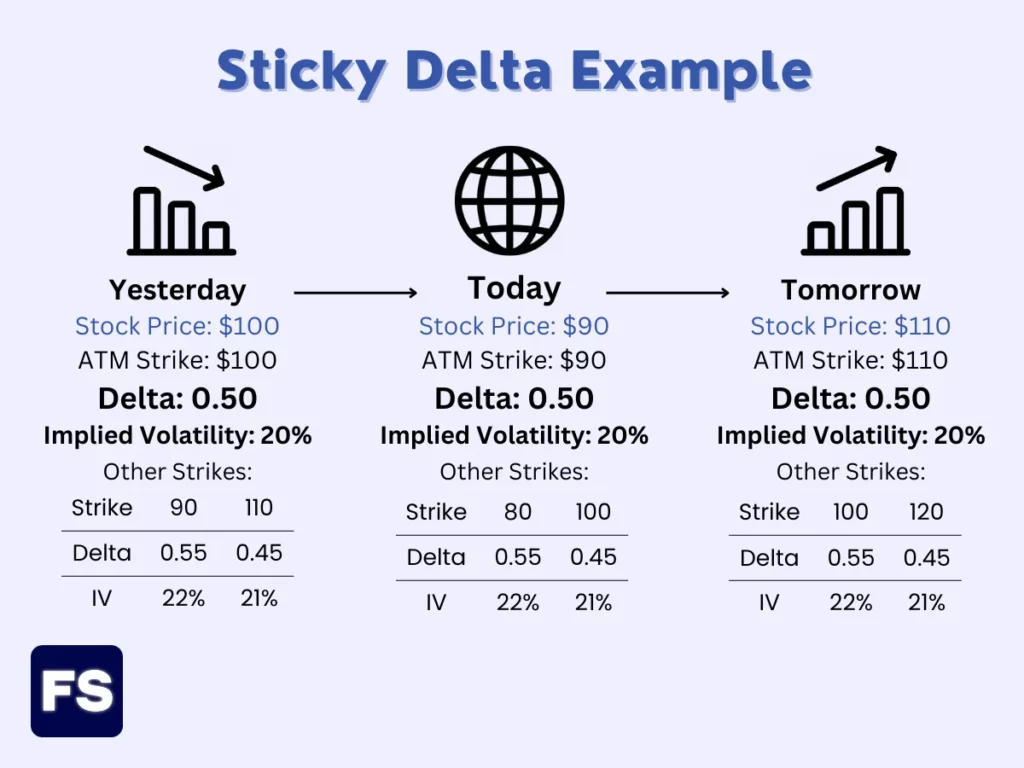
In this situation, implied volatility remains unchanged for a given delta or moneyness. And options with the same moneyness (effectively, the equivalent of option delta) trade at the same volatility.
Sticky Delta vs. Sticky Strike Rule
The volatility-by-strike or sticky strike rule is another popular approach to volatility surfaces. It assumes changes in the underlying asset price do not affect the implied volatility for an option with a given strike price. That is, the volatility depends only on the strike price.
Under the sticky strike model, if an ATM option goes OTM, its implied volatility stays the same. Every strike has a fixed implied volatility.
As we’ve seen, sticky delta (or volatility-by-moneyness, or sticky moneyness) in contrast, assumes the volatility for a particular maturity depends only on moneyness. Meaning, the IV for a particular delta does not change even if the underlying price changes up or down.
Both approaches serve as rules of thumb about how volatility surfaces change over time. And provide a basis for calculating the greeks.
