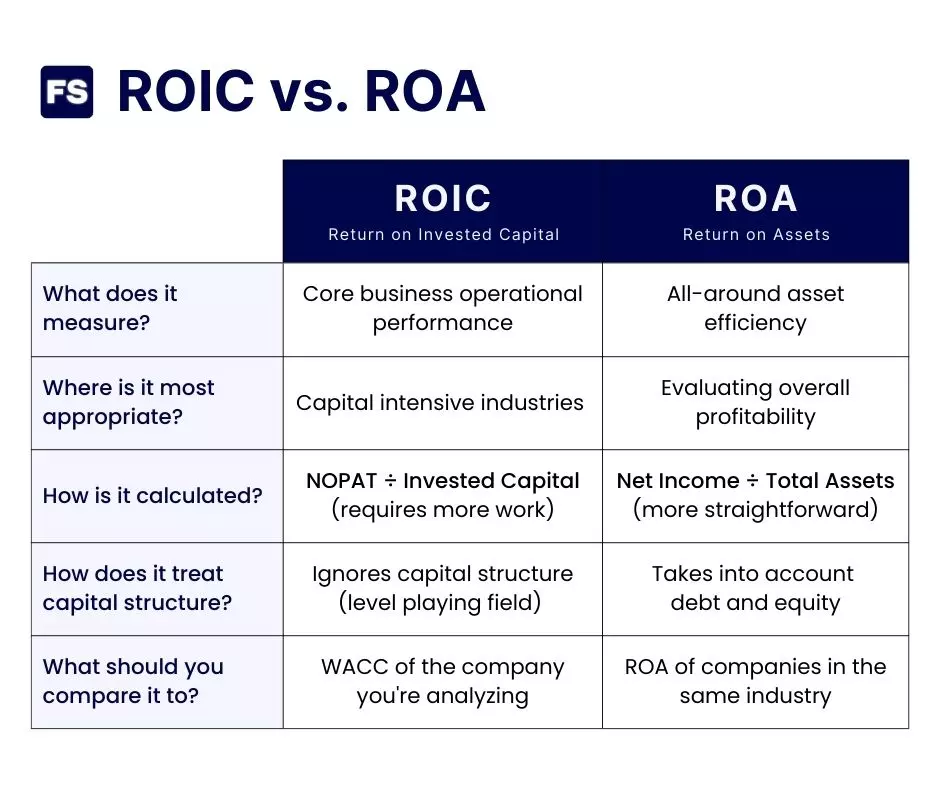
The fundamental difference between ROIC and ROA lies in the difference between invested capital and total assets.
The Return on Invested Capital compares operating income to money shareholders and lenders have put into the company, which tells you its ability to generate cash regardless of its capital funding structure. The Return on Assets on the other hand, weighs the net income against all of the company’s assets, which is a measure of asset efficiency.
Want a more comprehensive answer? Keep reading.
By the end of this article you’ll know the difference between ROA vs. ROIC (according to the top business schools and private equity firms)—and understand when is it more appropriate to use each.
Ready? Let’s dive in:
What Is ROIC
How much after-tax operating profit does the company generate for all its investors and the capital they invested?
This is the question Return on Invested Capital (ROIC) answers.
It measures the after-tax operating profit the company generates (excluding interest expenses) and compares it to the capital raised from equity and debt holders.
How do you calculate this financial ratio? The ROIC formula is the following:
Where:
- NOPAT (Net Operating Profit After Taxes) is the earnings of the company if it had no financial debt. It measures operational efficiency without the influence of leverage. You calculate it by taking out taxes from operating income, more specifically EBIT x (1 – Corporate tax rate).
- Invested capital is the money that finances (generally through a mixture of debt and equity) the assets the company needs to generate the NOPAT. You can also think of it as the money investors have put into the company and get a return for it. How do you calculate it? By subtracting non-interest-bearing current liabilities from all the assets the company uses in its operations to generate profits.
Now, how do you interpret the ROIC?
The higher the ROIC, the more returns the company is generating for its investors.
The final ROIC number, which is expressed as a percentage, is most useful when you compare it to the firm’s WACC, the Weighted Average Cost of Capital. Why?
Because the WACC is the investors’ expectations for the company. It is the minimum rate of return required by shareholders and lenders.
If the ROIC is greater than the WACC, the company is creating value for its investors.
In contrast, if ROIC is lower than WACC, the company is destroying shareholder value.
You should consider not only the final ROIC number, but also its trend.
A rising ROIC signals the company is outshining its competition, and/or that its managers are making great capital allocation decisions. A falling ROIC is an early warning sign of bad investment choices or growing competitors.
Hence:
ROIC is most appropriate for assessing companies in capital-intensive industries. That is, industries that require large amounts of capital investments.
Energy production, construction, and manufacturing players too name a few, benefit from staying on top of how their capital employed is generating future cash flows.
Of the three measures of operating returns (Return on Equity and Return on Assets being the other two), ROIC is the most useful to analyze the financial performance of the underlying core business operations.
What Is ROA
How much net income do the company’s assets generate?
This is the question Return on Assets (ROA) answers.
It’s a profitability ratio that’s pretty straightforward to calculate. The ROA formula is:
Where:
- Net income, also called the bottom line, is the net profit of a company after every single cost is taken into account. It’s the amount by which total revenue exceeds total expenses. You can easily find it in the income statement of any company.
- Total assets are all the resources of a company. You can also easily find it in the balance sheet. Analysts typically use the average value of assets for the period in question, as opposed to just the last period. Why? Because the asset total varies over time with the acquisition or sale of facilities, buildings, vehicles, land, or equipment, among other items. Hence, using average assets is more accurate.
The higher the ROA number, the better. It means the firm earns more money for each dollar invested. Put simply, a higher ROA means high asset efficiency.
Return on assets is sensitive to working capital. For example, an equal increase in the company’s accounts receivables and accounts payables will increase total assets and thus lower ROA. The ROIC avoids this problem.
It is most useful for companies in the same industry. Different industries can have wildly different asset bases, rendering the comparison useless.
Most analysts believe ROA is most useful when comparing banks. Why? Because the items in the balance sheet of a bank are recorded at the market value, as opposed to the historical cost. This results in a more precise image of the real value of net assets.
For non-financial companies, debt and equity capital are split rigorously, as well as the returns to each:
- Net income is the return for equity investors (shareholders).
- Interest expense is the return for debt providers (bondholders and lenders).
What does this mean?
The common ROA formula mixes things up by comparing returns that go to equity investors only (net income), with assets funded by both debt and equity investors (total assets).
A variation of the ROA formula that fixes this inconsistency between the numerator and the denominator adds back interest expense (net of taxes, to eliminate the tax savings leverage provides) to net income before dividing everything by the total assets.
Difference Between ROA and ROIC
Before detailing the difference between these two financial metrics, let’s look at some similarities:
Both the Return on Assets and Return on Invested Capital are best used when comparing a peer group of companies in the same industry and with similar operations.
For example, it’s not optimal to compare a small tech firm like to a manufacturing international conglomerate.
They’re also both the higher the better.
Either a ROIC or a ROA that rises over time indicates business is booming—earning more and increasing its profit margin with each investment dollar spent.
Now, let’s see the differences:
It’s easier to understand the difference if we break it down between the numerator and the denominator that go into each formula.
Numerator: NOPAT vs. Net Income
NOPAT evaluates the operating efficiency of a company’s core operations without considering debt.
In contrast, net income is a company’s profit net of all expenses. It takes into account capital structure.
NOPAT does not consider interest expenses. These lower the net income, but also the taxes the company pays.
This means NOPAT is an indicator of core business operations performance, without the effects of how those operations are funded. Why do this?
Because a company can always optimize how it funds its business. But if the business at its core is unprofitable before even taking into account costs of leverage, then it has a big problem.
Denominator: Invested Capital vs. Total Assets
Although it is easy to mix up the total assets of a company with its invested capital, these two are not the same.
Invested capital (to calculate ROIC and EVA) focuses on operational performance. Why? Because the numerator in the ROIC formula is the NOPAT. As such, you must hold the denominator to the same standards and focus on operational items as well.
Only capital that pays either dividends or interest to investors is considered, and the assets that don’t contribute to generating revenue are excluded.
Total assets on the other hand, is simply the sum of all the resources (tangible and intangible, short-term and long-term) a company has. You can easily find it in the balance sheet of any business.
As opposed to invested capital, total assets include everything.
Based on this, when should you ROIC and when should you use ROA?
When To Use ROIC vs. ROA
Both metrics evaluate a company’s performance, but they measure different aspects of its financial health.
ROIC is how efficiently a company is using its capital to generate cash flows.
Because it does not take into account capital structure, it is useful if you have to compare companies with very distinct ways of funding their operations.
ROA measures how a company generates net profits relative to its total assets.
It is a broader measure of a company’s profitability. If you’re evaluating a company’s overall profitability, ROA may be more suitable.
ROIC vs. ROA Example
Let’s go through an example to put these concepts in motion.
These are the financial statements of a company in the food retail sector, hence the low net margins and negative cash cycle:
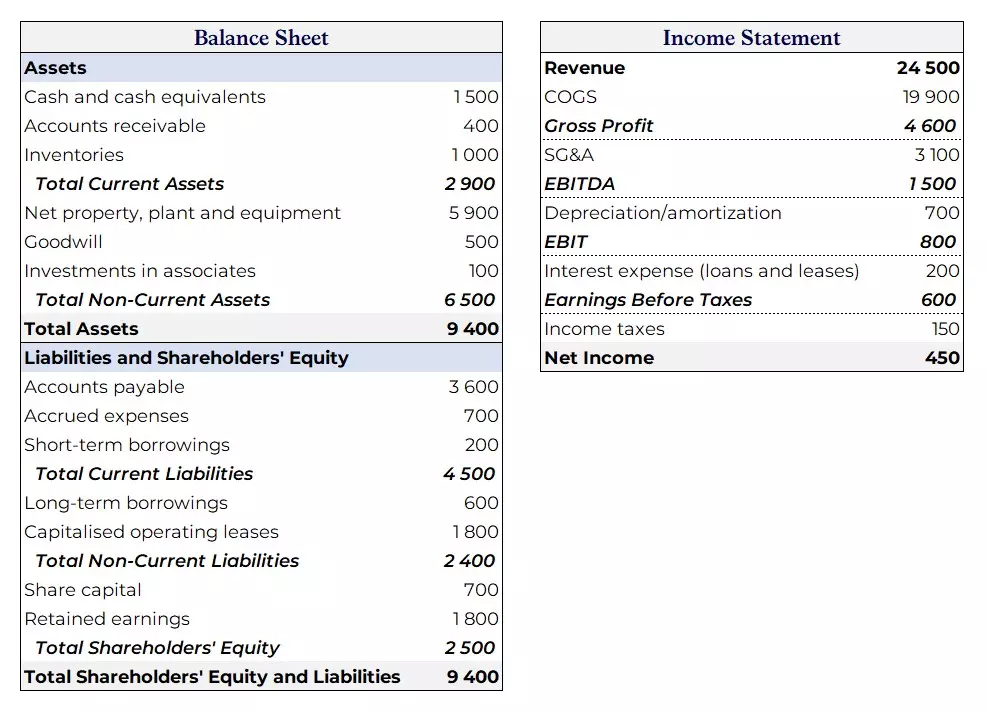
I consider a tax rate of 25%.
Right away you have all the information you need to calculate the Return on Assets—net income and total assets. But for the Return on Invested Capital? You need to make some calculations:
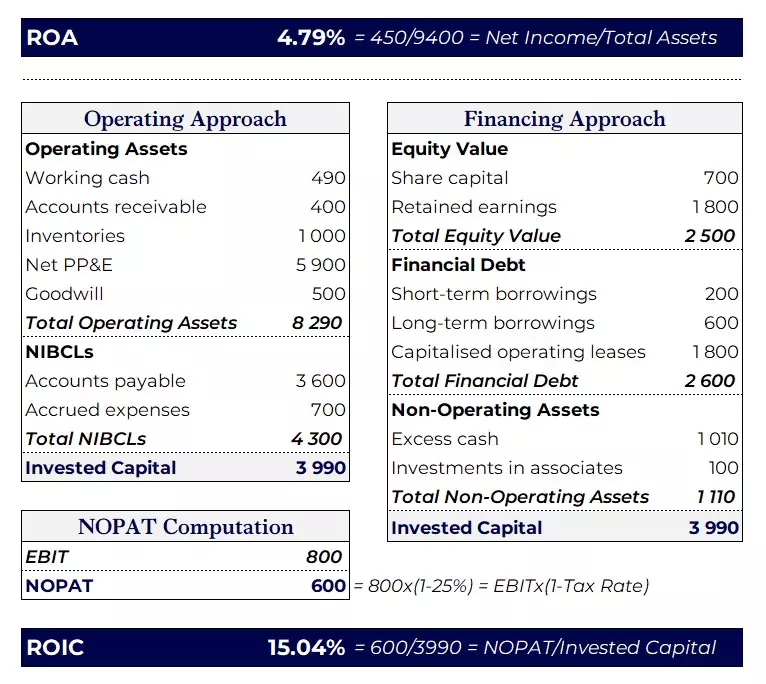
I consider working cash is 2% of sales, while the remaining is excess cash (cash or other marketable securities not included as part of working capital).
You have two ways of getting the capital invested:
- Operating approach: Operating assets net of non-interest-bearing current liabilities (NIBCLs).
- Financing approach: Sum of the book value of equity and financial debt, minus non-operating assets.
Both should give you similar results.
See the big difference between ROIC (15.04%) and ROA (4.79%)? This typically occurs in companies that have:
- Negative cash cycles. The increased negotiating power with suppliers allows the company to increase its debt to them and pay later. This effectively means it is borrowing money at no interest, increasing the firm’s value (total assets). On the contrary, this money is deducted from invested capital, making it a smaller number.
- Lots of non-operating assets, such as equity investments and marketable securities. These assets make the invested capital final number smaller as well, but are included in total assets.
- High costs with interest expenses. This means the difference between NOPAT and net income is significant.
- Outside investments increasing net income, as these also are not considered in NOPAT, but are in net income, creating a gap.
Are these good numbers? It depends.
As an investor, would you be happy with a company generating 15% returns on your money? I know I would.
Ultimately, these metrics hold the most value when compared between a peer group of companies, as opposed to isolatedly.
ROIC vs. ROA Frequently Asked Questions
Is ROA the same as ROIC?
No. ROIC measures how much return a company generates for every dollar its investors have put into the business, while ROA measures how efficiently a company uses its assets to generate net profits. ROIC requires a bit more work to calculate while ROA can be calculated directly from the balance sheet.
ROA vs. ROIC: Which is better?
It depends mostly on the company you want to value. ROIC is the most useful in assessing the performance of the underlying business, so if you’re comparing two companies with very distinct capital structures choose that. ROA is better if you want to evaluate overall profitability and take into account the structure of the capital that funds the company.
