Time series data is data collected at regular intervals over time. On the other hand, cross-sectional data is a snapshot of a group of things or people at the same point in time.
For example, a time series dataset of the number of cars sold each month over the course of 5 years consists of 60 data points (one for each month). Meanwhile, cross-sectional data is a dataset composed of not only the number of cars sold in one month, but also information on the car model, price, color, and other variables.
Learn when to use time series and cross-sectional data in practice:
What is Time Series Data
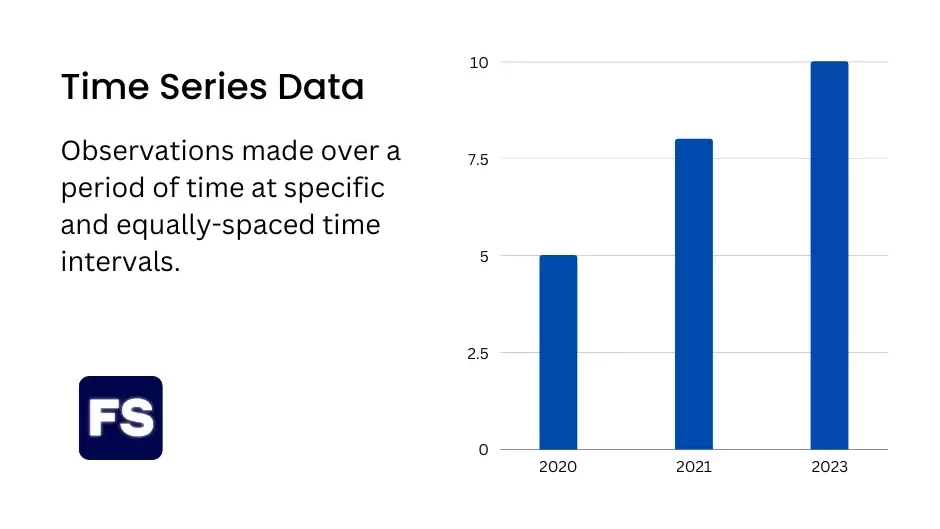
Time series data allows you to track changes over time. It consists of observations on one or several variables over time—the most common frequencies being hourly, daily, weekly, monthly, quarterly (every 3 months), and annual.
Here are two examples of time series data:
- The daily closing price of Apple’s stock over the course of a year. This data set consists of the stock price recorded at the end of each trading day for 365 days.
- The monthly revenue of a Walmart over the course of one year. The data includes the total sales for the company recorded at the end of each month for 12 months.
In both of these examples, we collect the data at regular intervals (daily or monthly) and cover a certain period of time (a year). This allows us to see how the stock price or sales of the company change over time.
You can use time series data to identify patterns in financial data, and make predictions about future values based on past behavior.
What is Cross-Sectional Data
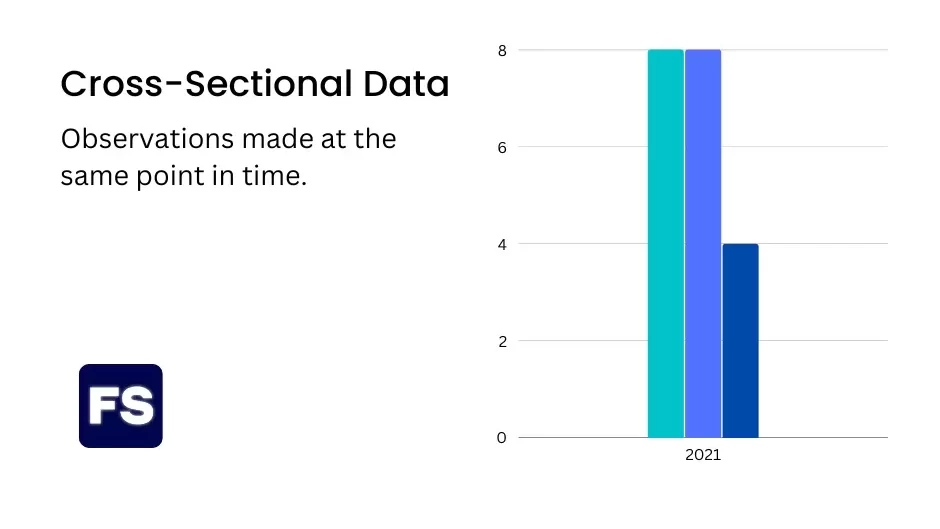
Cross-sectional data allows you to compare data at one point in time. It consists of observations of multiple variables at one specific point in time.
The data reflects the characteristics of individuals at a single moment, rather than over a period of time.
Here are two examples of cross-sectional data:
- A survey of households to learn about their saving and investment habits. The survey collects data on the types of investment products that households have, how much they save and invest, and their attitudes toward risk.
- A study of the financial performance of companies in the tech industry. The study collects data on the revenue, profits, debt levels, and market share of the companies.
Both examples are ways to understand the financial characteristics of a group of people or companies at a specific point in time.
This type of data does not provide information on how these characteristics change over time though.
Difference Between Cross-Sectional and Time Series Data
Cross-sectional data is useful when you want to understand information about a group of individuals at a specific point in time. However, it doesn’t tell you how those characteristics change over time. For that, you need time series data, as it studies the values of a particular variable at different points in time.
To further drive the point home, let’s look at an example not related to finance:
Imagine you’re a researcher conducting a study to understand what influences people’s health. You want to know whether or not diet, exercise, and alcohol use are related to people’s health.
To collect the data, you recruit a group of 100 people and ask them to complete a survey about their diet, exercise habits, and their use of alcohol. You also ask the participants their age, gender, and if they have chronic health problems.
This data is an example of cross-sectional data.
It reflects the lifestyle of the individuals at the moment when they completed the survey, and doesn’t look at how it changes over time.
However, you also want to study how people’s behaviors change over time. As a result, you ask the participants to complete the survey again one year later. This way, you can compare their responses at two different points in time and understand how their health habits changed over one year.
This data is an example of time series data.
You collected it at regular intervals (once at the beginning of the study and once one year later). It reflects the characteristics of the individuals at multiple points in time, and allows you, as a researcher, to understand how they changed.
Tips for Working with Time Series and Cross-Sectional Data
Both types of data sets have advantages and disadvantages you need to account for, especially in the context of regression analysis.
When working with cross-sectional data, there are two common problems that make it difficult to analyze the data accurately—multicollinearity and heteroscedasticity.
Multicollinearity happens when two or more of the things you are measuring are related to each other. The problem? It becomes difficult to know which thing is causing a change in the results.
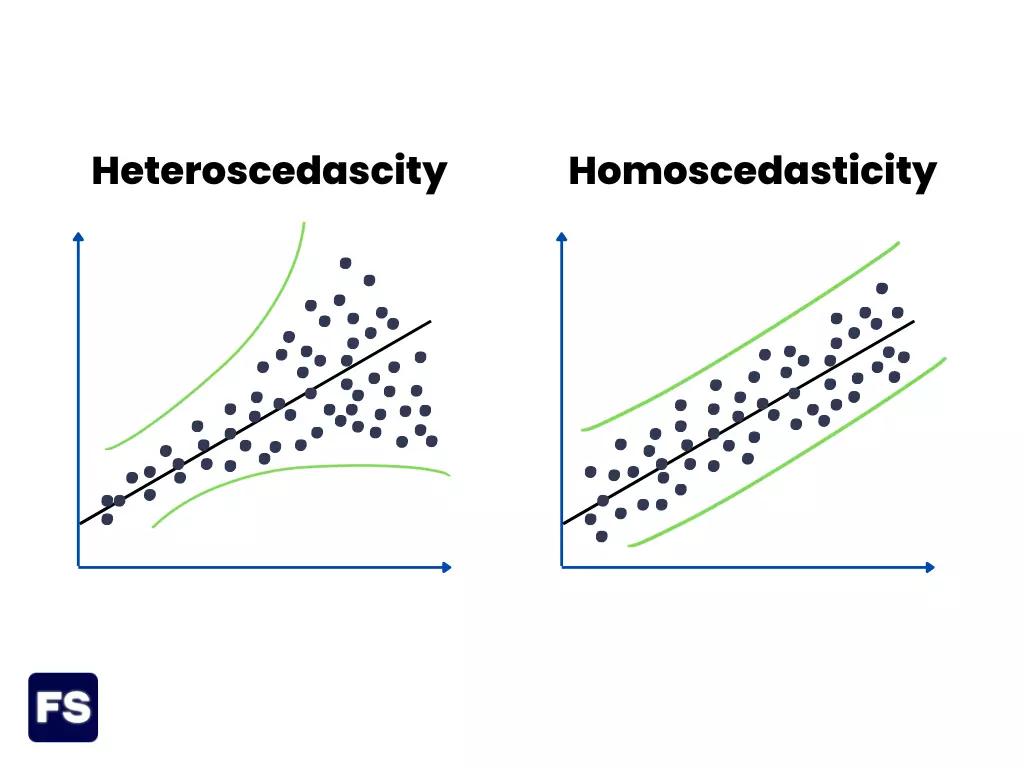
Heteroscedasticity happens when the amount of error in your measurements is not constant across all the data.
For example, the profits of small companies tend to be more variable than the profits of large companies. This happens because small and large companies are different when it comes to market share, products offered, and the number of workers. The problem?
The irregular variance in the profits makes it difficult to compare the performance of different companies, and can lead to inaccurate conclusions if you don’t account for them.
When working with time series data, there is one common problem that can make the data difficult to analyze accurately. It is called autocorrelation (or serial correlation).
This happens when the error of your measurements has patterns.
Let’s say you’re measuring the price of a forward contract over time.
Underlying asset, supply and demand, interest rates, inflation. These are all factors that influence the markets. And they are often correlated with each other—meaning they move in the same direction.
When the factors that influence forwards are correlated with each other, you have autocorrelation. The problem?
If you’re comparing data on forward contracts on different assets, this pattern hinders your ability to see important differences between them.
Overall, serial correlation makes it harder to see what’s causing changes in the data, and can lead to inaccurate conclusions. It is important to carefully check for serial correlation when working with time series data.
Frequently Asked Questions (FAQs)
Can data be both time series and cross-sectional?
Yes. This happens when data reflects both the characteristics of the something at multiple points in time (time series), as well as the characteristics of the group of somethings at a specific point in time (cross-sectional). For example, taking the opening price of 20 stocks every day for 1 year straight is a data set that is both time series and cross-sectional.
Is time series data better than cross-sectional data?
You can’t say one is better than the other. They are both useful for different purposes, so it depends on the question you want to answer. Time series data is useful to study how a variable changes over time. Cross-sectional data is useful to understand the characteristics of a group of individuals at a precise point in time.
