This is an introduction to Statistical Inference, and its most useful tool—Hypothesis Testing.
We’ll start off with an overview of the field of Statistics this tool belongs to, as well as the basic concepts we need in order to understand it.
After that, you’ll learn how Hypothesis Testing works in 5 steps.
Let’s dive right in:
What is Statistical Inference?
Say you’re a farmer and just had your biggest harvest of apples ever. 2,000 shiny red fresh treats you want to sink your teeth in immediately.
Now, you want to measure the average size of your apples, as you believe that’s a good indicator of how healthy your apples are.
The problem? It’s not practical to measure a whole population of 2,000 apples one by one. It would take too long.
How do we solve this problem?
Statistical inference.
Inference is the same word as extrapolation—which is when you assume something based on something else.
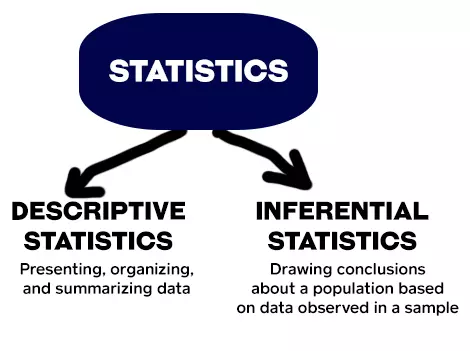
Statistical inference allows us to draw conclusions about a population based on a sample of that population.
Most times, we want to measure something in a huge population. The problem is that is rarely possible due to its size. The solution? Samples.
Inferential Statistics can be contrasted with Descriptive Statistics—which is only concerned with the properties of the data we observe, like the average and the mean.
Descriptive statistics aims to summarize a sample, rather than use the data to learn about the population the sample of data is thought to represent.
If we could get to the whole population easily, Statistics would be just descriptive statistics.
In the case above, you would analyze 100 apples and draw conclusions for the whole population based on that smaller sample.
Now:
The main tools of statistical inference are Confidence Intervals and Hypothesis Testing.
But before we get into that, it’s important that we define the difference between Statistics and Parameters:
Statistics vs. Parameters
Parameters are Greek letters used to represent observations in the population.
Statistics represent observations in the sample. Instead of Greek letters, we use our dear Latin alphabet (the letters you’re reading right now).
Statistics help us estimate parameters.
Here’s a good article on how to tell the difference between statistics and parameters.
And here’s a table with the symbols of population parameters and their corresponding sample statistic:
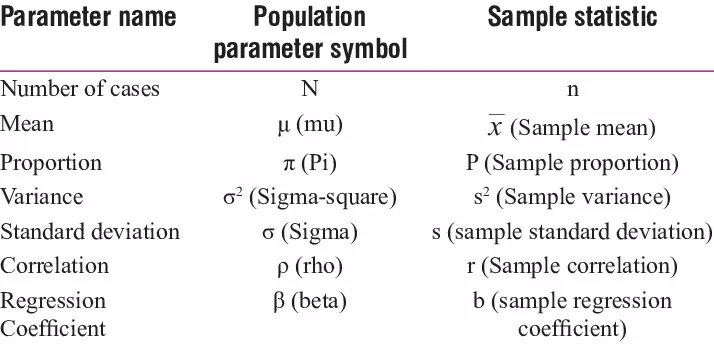
The mean (also known as average) is the sum of all values divided by the number of values.
A population proportion is a fraction of the population that has a certain characteristic.
Variance refers to a measurement of the spread between numbers in a data set. In other words, how far each number in the set is from the mean.
How do you calculate variance? By taking the mean of the data points, subtracting the mean from each data point individually, squaring each of these results, and then calculating another mean of those squares.
Standard deviation is the square root (√) of the variance. It is easier to picture and apply. Why? Because the standard deviation is in the same unit of measurement as the data, unlike the variance.
Now, correlation and regression:
Correlation measures the degree to which two variables move in relation to each other. In other words, it indicates some form of association.
A regression relates a dependent variable to one or more independent (explanatory) variables.
It tells us whether changes in the independent variables explain the changes in the dependent variable. Sounds similar to correlation, right? Well, they’re not quite the same:
Correlation measures how strong the relationship between two variables is, whereas regression how one variable affects the other.
Now, sample statistics will likely vary from sample to sample.
You can draw multiple samples from the same population, and those samples will give you different results.
Because of this, sample statistics are also called random variables. Their value is uncertain every time you collect a new sample.
This means a sample will never be a perfect representation of its whole population.
We don’t know for sure how well the sample represents the population.
The difference we believe exists between the sample and the population is what we call the sampling error.
What’s the point of me telling you this?
I want to remind you that in inferential statistics you need to be careful in how you word the conclusions you take.
Data from a sample will never substitute data from a population. It simply helps us estimate what’s going on in the population.
Got it? Alright, let’s see how we can actually put this into practice with hypothesis testing:
Hypothesis Testing Explained in 5 Steps
When using Statistics to analyze financial markets, we need to know how to formulate and decide on hypothesis testing.
Hypothesis testing is the use of statistics to determine the probability that a given hypothesis (involving parameters or not) is true.
We can explain the process in 5 steps:
#1) Identify the Hypotheses
The first step is to specify the null hypothesis (H0) and the alternative hypothesis (H1).
In this context, the word “null” is kinda like default. The default hypothesis. The currently accepted value for a parameter.
And what you do is challenge that. You’ll come up with an alternative hypothesis you want to test.
Your null hypothesis is always going to assume whatever you’re researching has no effect, or isn’t true. It’s the hypothesis you “want” to reject and prove wrong.
However, the null hypothesis is “innocent until proven guilty.”
That’s why you start with the exact opposite of that—we assume the null hypothesis is true.
In general, the null hypothesis says there’s no difference between the means of two methods (H0: µ1−µ2=0). In that case, the alternative hypothesis is H1: µ1≠µ2.
Continuing the example of the apples… You know the average size of the apples in your harvest is usually around 8cm. How do you compute a hypothesis test to check if this year things are similar?
- H0: The average apple size is 8cm.
- H1: The average apple size is different than 8cm.
Simple as that.
You can also test the correlation between two variables. In this case, the null hypothesis states there is no correlation (H0: ρ=0) and the alternative hypothesis is H1: ρ≠0.
H0 and H1 are always mathematical opposites.
Keep in mind:
We’re not going to prove anything to be true. We’re just saying this is false or this is not false. The hypotheses are made about the population, not the sample.
#2) Collect a Sample from the Population
As we’ve seen above, measuring a whole population is most times difficult and time-consuming. Instead, you collect random sample data to draw a generalization about the population.
But how do you determine the sample from a population?
To extract valid conclusions from your test, you have to carefully select a sample that is representative of the group as a whole.
There are many ways to draw a sample, as it changes based on what you’re testing.
To test the mean size of your population of apples, you can’t pick a group of apples from the same tree. You need to go around your farm and pick a couple from each tree.
After that, you use information about the samples to decide whether there’s a difference between the means.
#3) Choose a Statistical Test
How do you actually test your hypothesis?
You do a statistical test to get a test statistic, which will tell you if the sample is believable given the null hypothesis.
The test statistic is calculated from sample data and helps you decide whether you reject H0 or not.
It’s important to choose the right statistical test for your hypothesis, as it varies according to the sample size and parameter you’re trying to measure.
Statistical tests assume the null hypothesis. They assume there is no relationship or no difference between groups.
Then, they determine if the observed data matches the values from the null hypothesis.
In other words, it will compare the null hypothesis to the value you get from the sample, and determine if the values are different enough to say they’re different.
The test statistic tells you if the data you get from the sample is statistically significant enough to reject the null hypothesis or not.
“Statistically significant”—what do you mean by that? (Druski voice.)
#4) Choose a Level of Confidence
You test a hypothesis and decide to reject it. How confident are you in that decision?
The level of confidence represents how sure you are that you made the right decision.
Doing a test with 99% confidence means that if you reject the null hypothesis, you’re 99% sure it was the correct thing to do.
In general, this value is either 90%, 95%, or 99%.
The complement to this is the level of significance (also called alpha, and represented by this symbol: α).
To get alpha, you simply subtract the level of confidence to 1.
So, the level of significance for a confidence level of 95% is 1-95%=5%.
The sum of the level of confidence with the level of significance is always 1. So they both tell you the same thing:
How sure are you that you’re making the right decision?
This is basically where you “draw the line.”
The average size of your apples is usually 8cm. This year you measure a sample, and get an average of 7.6cm. You want big apples. Should you be concerned? Maybe not.
But what if instead of 7.6, the average size of the sample is 6.5cm? Ok, there may be something going on. But still, not necessarily small apples, right?
What if it’s 5cm? Wow! From 8cm to 5cm. Most people would agree that now you have a problem. Something is different in this year’s harvest.
Do you see the problem? Where do you draw the line?
It’s subjective. Everyone has different opinions. And that cannot happen in Statistics.
We need a concrete way to look at the null hypothesis, collect data, and decide when to reject.
That’s what a hypothesis test does:
It collects the data from a sample, puts it in an equation, and gives you a number (p-value) that will help you decide when that test statistic is too high or too low—and when to reject or not.
Without having to guess. It gives you concrete boundaries.
How sure do you want to be of your decision?
Now, here’s what we do with those values:
#5) Look at the P-value and Decide
So, how do we know if we should accept the alternative hypothesis or default to the null hypothesis because the data isn’t convincing?
We look at the probability of getting the results the null hypothesis indicates.
If that probability is super small and insignificant, then the null hypothesis probably isn’t true.
We would then reject the null hypothesis and believe the alternative hypothesis.
The p-value estimates that probability. It answers this question:
How likely is it that I will see the difference described by the test statistic if the null hypothesis is true?
The most common significance level is 5%, so if the p-value is below that, you can reject H0.
The Bottom Line
Half the challenge with hypothesis testing is turning a real life problem into an hypothesis. Then, it’s all about figuring out the test you need to study it.
This is the thing that will give you the p-value—helping to decide whether to reject your null hypothesis.
In Statistics, a result is called statistically significant if it is unlikely to have occurred by chance.
